Who Votes in America?
In the 2020 U.S. presidential election, voter turnout was the highest it has been in a century, and 94% of Americans reported in a Pew Research Center survey that they found it “easy to vote.” This is not surprising; in response to the special challenges posed by the pandemic, many states adjusted their voting procedures to expand opportunities to vote by mail and made it easier to drop paper ballots in boxes outside densely populated polling places.
Since 2020, many states have proposed—and some have enacted—laws that will change how many Americans register to vote and cast ballots.
Critics of these changes charge that they would have a disproportionate impact on minorities and other groups that may find it more difficult to comply with new procedures or to get to the polls in person. Supporters of these new laws claim they are necessary to protect election integrity and to tighten up election procedures that were loosened too much amid the pandemic.
We won’t have definitive data on who is right until after the 2022 midterm elections. But here’s one thing that can be said for sure: Decades of data running through the 2020 election reveal that race is no longer the biggest determinant of who does and does not vote in America. Today, age, income, gender, and differences in enthusiasm that shift in every election play a much bigger role.
But is that trend likely to continue in future elections? That’s a question The New Center set out to explore. Below, we delve deeper into the voting patterns of various groups, drawing on two strands of evidence—analyses of voting trends prior to and including 2020, and research on the potential effects of new requirements.
A SHORT HISTORY OF VOTING LAWS AND TRENDS
Some critics of the state election bills passed by Republicans have described them as Jim Crow 2.0, and President Biden likened them to “Jim Crow on steroids.”
They are essentially saying that the new proposals are somehow worse than the original “Jim Crow” era, which entailed poll taxes and literacy tests, violent intimidation of Black voters by the KKK, and even outright prohibitions on Black voters participating in party primaries in southern states. To suggest that any of the actual policy and procedural changes in new state voting measures are akin to Jim Crow laws is an exaggeration.
And yet, many of the concerns expressed today about efforts to suppress voter turnout are based on an uncomfortable—and indisputable—historical reality. During most of the twentieth century, the right to vote was not uniform across racial groups because white political leaders in mostly southern states intentionally made it harder for Black people to vote.
Washington’s passage of the 1965 Voting Rights Act began dismantling these Jim Crow laws and sparked an historic shift in voting patterns. Look across recent elections and you will see the biggest disparities are not by race, but by the realities that:
- Women vote in much higher numbers than men;
- Older people vote in much higher numbers than younger people; and
- Lower educated, lower-income voters often don’t show up unless they have a compelling candidate who can rally them to the polls. This likely explains why overall Black voter turnout surged to historic highs in 2008 and 2012, when Barack Obama was a candidate, and turnout among whites with a high school degree or less surged in many swing states in 2016, when Donald Trump was on the ballot.
HOW WILL STATE VOTING CHANGES PASSED AFTER THE 2020 ELECTION NEGATIVELY IMPACT TURNOUT IN FUTURE ELECTIONS?
In the aftermath of the 2020 election, new state laws ostensibly focused on guaranteeing election security have raised concerns that voter suppression may be on its way back. But research suggests that whatever their motivation, these laws may not have the significant impact on voting that their critics fear.
1. Laws governing registration, voter ID, and mail-in voting generally have very little impact on voter turnout.
Voter ID: A 2021 study published in Harvard’s Quarterly Journal of Economics analyzed ten years’ worth of elections to assess the impact of voter ID laws on voter turnout and election fraud. The authors found no negative impact on voter turnout, perhaps because the enactment of these laws mobilized campaigns to contact voters and inform them of the new requirements. Strict ID laws were found not to have any effect on turnout or registration for demographic groups based on their gender, race, age, or party affiliation. Further, these laws had no impact on actual or perceived voter fraud.
No-Excuse Mail-In Voting: A Stanford University study analyzed the effects of no-excuse mail voting on turnout in the 2020 election. Turnout did increase in states that implemented this change in advance of the 2020 election, but no more than it did in other states. These results may seem counterintuitive given the record number of mail-in ballots cast due to concerns about COVID-19 spread. They also found that there was no partisan advantage to no-excuse absentee voting—while the number of Democrats who chose to vote by mail increased, this was offset by a decline in their rate of in-person voting. The authors concluded that voter interest and enthusiasm were considerably more predictive of voter turnout than the mechanics of how they vote.
Early Voting: In 2016, the Government Accountability Office reviewed 20 studies on the effects of early in-person voting. A majority of these studies found that early in-person voting had an insignificant or even negative impact on turnout. One possible explanation is that spreading out the election period might remove some of the social and party-driven pressure associated with a single day of voting. By comparison, vote-by-mail and same day registration are found to increase overall voter turnout, even though these policies confer no partisan advantages.
2. It’s still too early to tell what effects these new state laws will have, although recent evidence points to increased rejection of mail-in ballots in Texas during the state’s most recent primary election.
In the March 2021 Texas primary, state election officials rejected more than 18,000 mail ballots, 126% more than in previous elections. The rejection rate in majority-Democratic counties was significantly higher (15.1%) than that in majority-Republican counties (9.1%).
VOTING TRENDS THROUGH 2020
Ultimately, it is still too early to tell whether the raft of state voting laws will change either overall turnout or turnout among various races, genders, or age groups. But a review of decades of data leading up to the 2020 election reveals that race was increasingly not the defining factor in determining who does and does not vote in America.
Insight #1: The gap between Black and white voter turnout has been shrinking steadily since the mid-20th century.
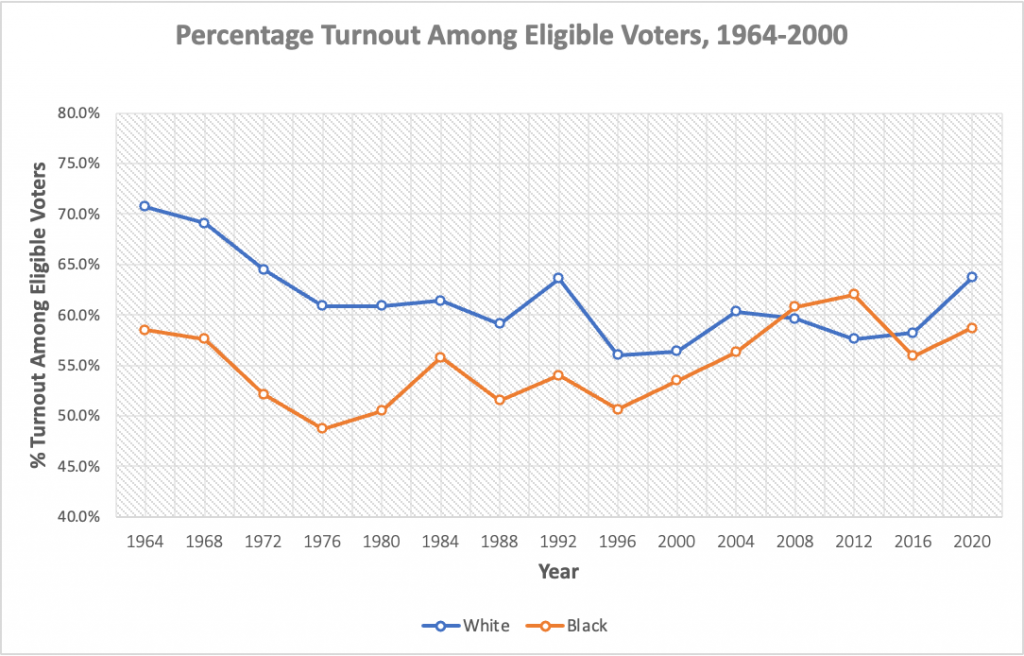
Source: U.S. Census Bureau/Bureau of Labor Statistics
Insight #2: Black and white women vote at roughly the same rate. To the extent that there is a gap between Black and white voter turnout overall, it is mostly explained by Black men voting less than white men.
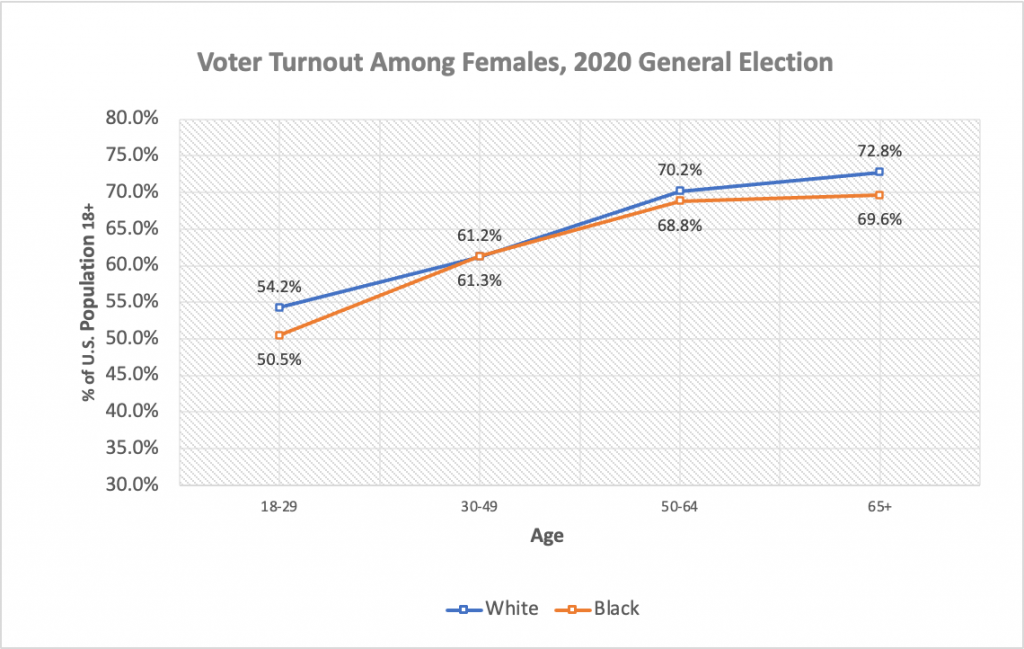
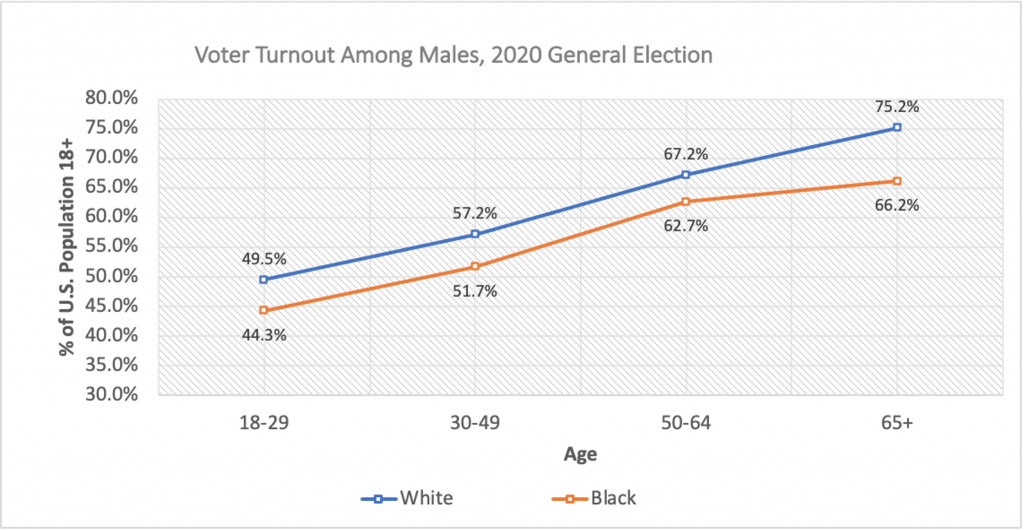
Source: U.S. Census Bureau/Bureau of Labor Statistics
Insight #3: Among Americans without a college degree, young people are least likely to vote.
| Turnout Among Voters Without a College Degree | ||||
| White | Black | Asian | Hispanic | |
| Males | ||||
| 18-29 | 37.8% | 32.8% | 26.5% | 25.8% |
| 30-49 | 42.9% | 39.8% | 28.1% | 26.4% |
| 50-64 | 58.9% | 56.5% | 31.6% | 38.2% |
| 65+ | 70.2% | 62.0% | 42.5% | 60.8% |
| Females | ||||
| 18-29 | 37.0% | 38.5% | 21.2% | 26.5% |
| 30-49 | 44.5% | 50.0% | 26.8% | 30.2% |
| 50-64 | 61.6% | 62.3% | 35.9% | 42.9% |
| 65+ | 67.7% | 66.5% | 41.8% | 52.6% |
Source: U.S. Census Bureau/Bureau of Labor Statistics
Insight #4: White males aged 65 and up vote more than any other racial demographic group in America. Hispanic males aged 30-49 vote the least.
| Demographic Groups Most Likely to Vote | Voter Turnout |
| White males aged 65+ | 75.2% |
| White females aged 65+ | 72.8% |
| White females aged 60-64 | 70.2% |
| Black females aged 65+ | 69.6% |
| Black females aged 50-64 | 68.8% |
| White males aged 50-64 | 67.2% |
| Black males aged 65+ | 66.2% |
| Black males aged 50-64 | 62.7% |
| Black females aged 30-39 | 61.3% |
| White females aged 30-39 | 61.2% |
| Demographic Groups Least Likely to Vote | Voter Turnout |
| Hispanic males aged 30-39 | 31.9% |
| Hispanic males aged 18-29 | 33.0% |
| Asian males aged 30-49 | 35.9% |
| Asian males aged 18-29 | 36.1% |
| Hispanic females aged 30-49 | 37.9% |
| Hispanic females aged 18-29 | 39.3% |
| Asian females aged 30-49 | 40.0% |
| Hispanic males aged 50-64 | 41.0% |
| Asian females aged 18-29 | 42.8% |
| Black males aged 18-29 | 44.3% |
Source: U.S. Census Bureau/Bureau of Labor Statistics
Insight #5: Most of the eligible voters who did not vote in the 2020 election were white.
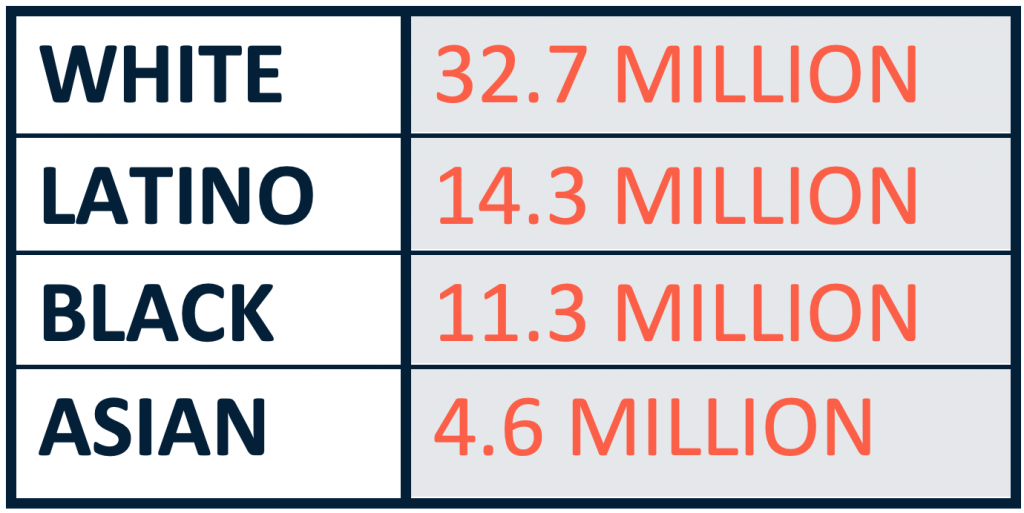
Source: No Labels
Insight #6: Someone living in a household making over $50,000 is 19 percentage points more likely to vote than someone living in a household making under $50,000.
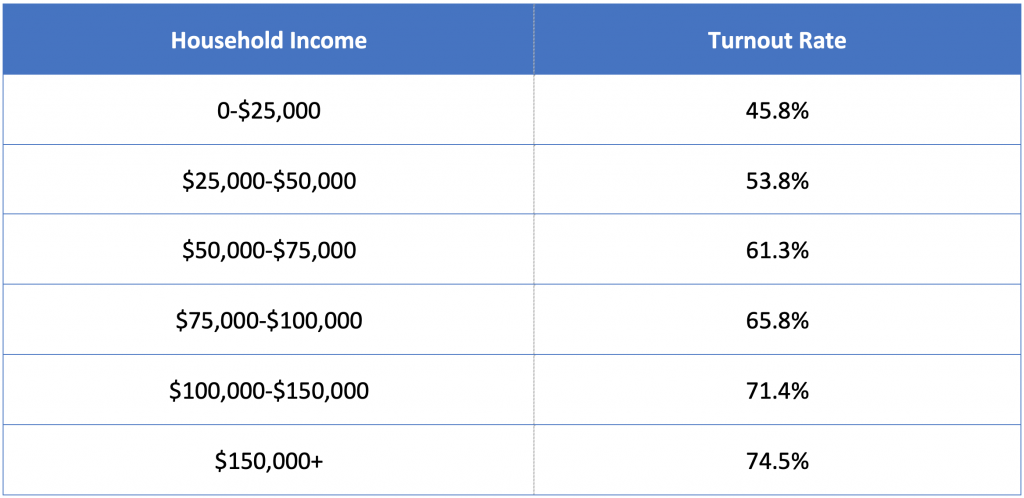
Source: U.S. Census Bureau/Bureau of Labor Statistics
Insight #7: Voters who live in presidential swing states are more likely to turn out than those who don’t.
Electoral competitiveness is a key determinant of turnout in swing states. In 2020, 69% of voters in swing states turned out compared to the national average of 66%.
Insight #8: In recent elections, Donald Trump brought more non-college educated whites to the polls and Barack Obama brought more Black voters to the polls.
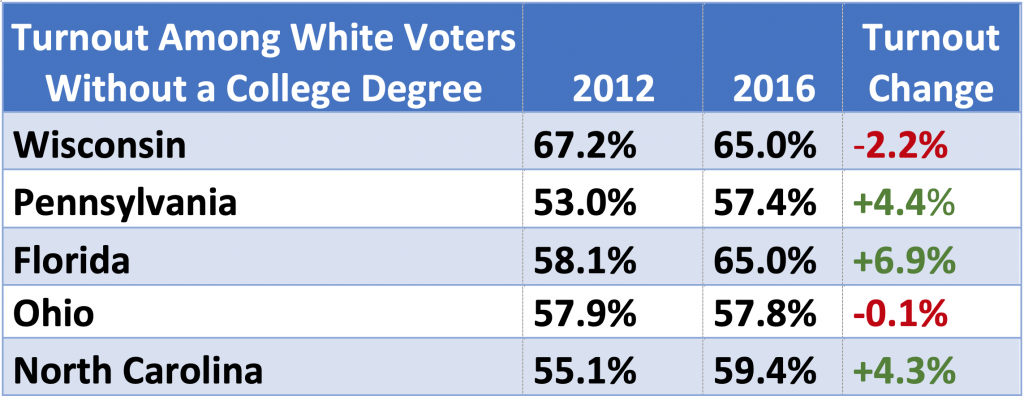
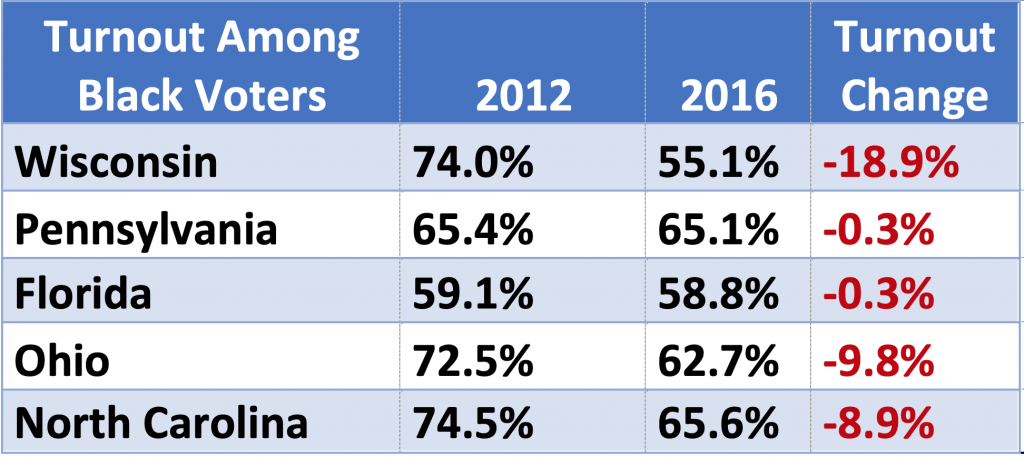
Source: Center for American Progress
Insight #9: Bad candidates with bad policies depress voter turnout.
According to the U.S. Census Bureau, lack of interest in the election, the candidates, or the issues was the most common reason why non-voters did not participate in the 2020 election.